Chapter 3 What is EDA?
3.1 Definition (from Wikipedia)
In statistics, exploratory data analysis (EDA) is an approach to analyzing data sets to summarize their main characteristics, often with visual methods. A statistical model can be used, but primarily EDA is for seeing what the data can tell us beyond the formal modeling or hypothesis testing task.
Exploratory data analysis was promoted by John Tukey to encourage statisticians to explore the data, and possibly formulate hypotheses that could lead to new data collection and experiments.
EDA is different from initial data analysis (IDA), which focuses more narrowly on checking assumptions required for model fitting and hypothesis testing, handling missing values and making transformations of variables as needed. EDA encompasses IDA.
3.2 The objectives of EDA
To Suggest hypotheses about the causes of observed phenomena
To Assess assumptions on which statistical inference will be based
To Support the selection of appropriate statistical tools and techniques
To Provide a basis for further data collection through surveys or experiments
3.3 Data analysis workflow
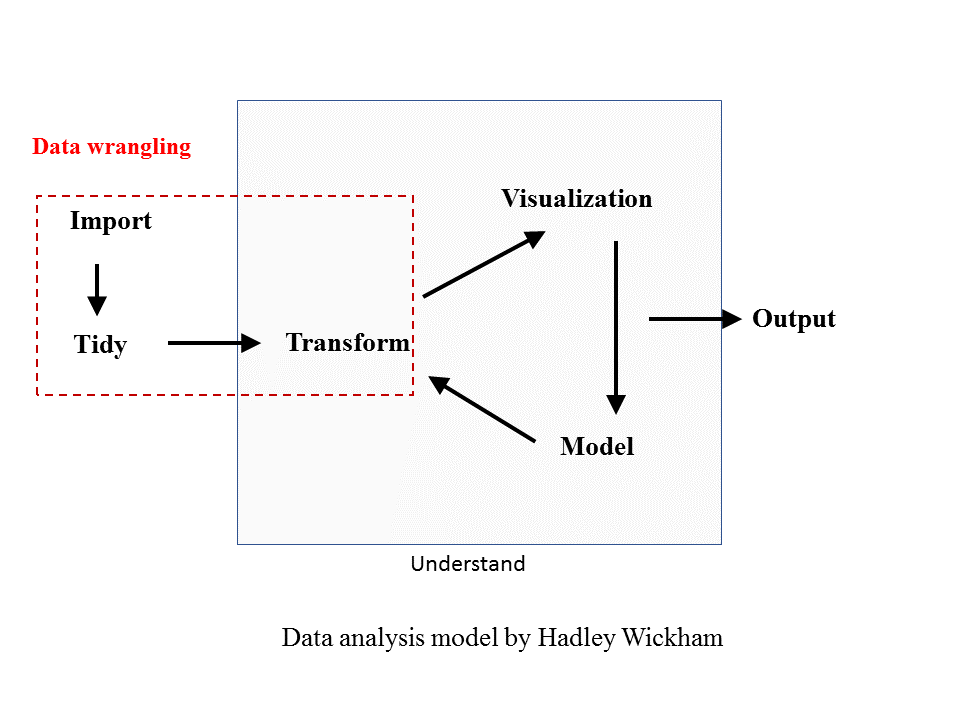
A common workflow for data analysis involves importing data, cleaning data, transforming data, visualizing and modeling data for reports or papers. However, you may notice that this is not a linear process. In other words, there is no magic way of understanding your data with a touch. Rather, it is a process where you need to try different ways of tranforming, visualizing and modeling your data. Therefore, EDA (within the grey square)is not a formal process with a strict set of rules, but an open process.
Fortunately, R offers a range of tools that can help us eaily summarize, visualize and model our data.
In this workshop, we first explore variation within a variable and then move on to covariation among variables.

Figure 3.1: Data analysis workflow