Chapter 3 What is data wrangling?
3.1 Data analysis workflow
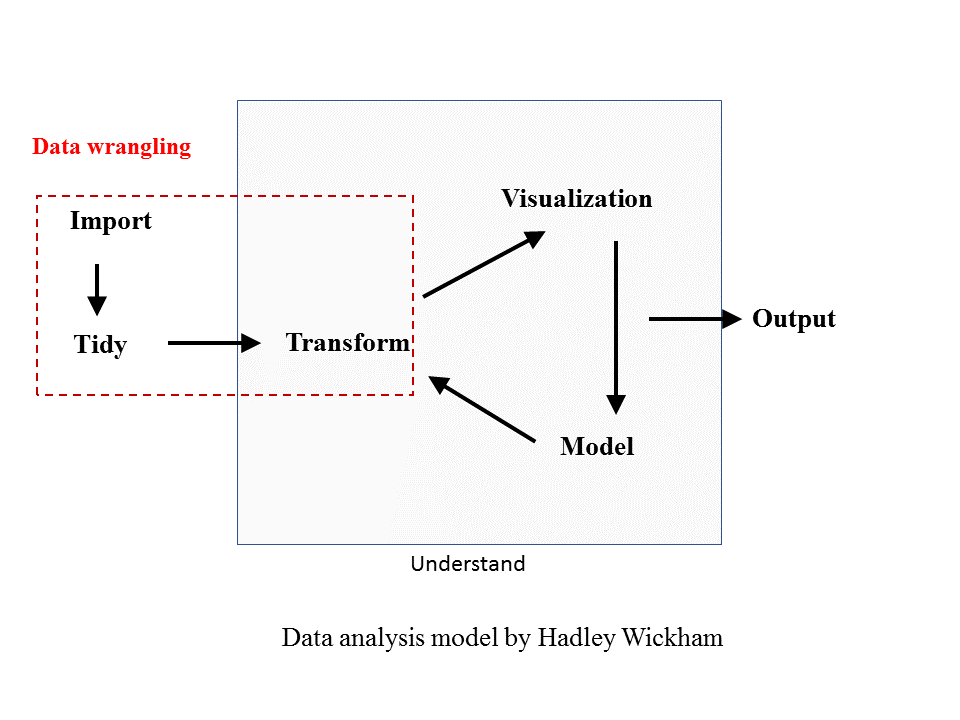
A common workflow for data analysis involves importing data, cleaning data, transforming data, visualizing and modeling data for reports or papers.
You may have the experience of using excel to do data cleaning and simple tranformation work with pivot tables and save the results in a spreadsheet. You can also draw bar charts, pie charts and histrograms in the spreadsheet. One thing I feel annoying is that in order to keep a record of what I have done, I need to SAVE a couple of sheets inside a workbook. Still, I can miss some steps and cannot recall I have done after a month.
When you need to do more complex stats modeling like ANOVA or linear regression, you may import the spreadsheet into SPSS and other stats packages.But if the data are not arranged in the way as required by these packages, chances are that you will have to go back to Excel again.
If you are lucky and you get all the analysis done. Usually at the end of the project, you end up having a number of .xsl or .csv files in your data folder. You may name them by the analysis you did or the date you generated them. But after six months, you can still feel unsure about what is exactly in these files, not to mention, to others who want to reuse it.
But if you are using R, things can be easiler because each step in the data analysis is recorded and fully reproducible.

Figure 3.1: Data analysis workflow
3.2 Data wrangling
Data wrangling (see the above figure in red box) involves some basic procedures (importing, tidying and transforming). R,and its packages, tidyverse in particular, provide a number of functions that can help us deal with data cleaning and tranformation. We will be learning how to use these functions in the follow sessions.